Create a Basic Map Visual
Learn how to create a simple map visual
Once you've installed GEOS BI, you're ready to add it to your report canvas and assign data fields to start visualizing your data.
In this guide, we’ll focus on visualizing points on a map. You can also use GEOS BI to visualize other geometries, such as lines or polygons, which will be covered later in the documentation.
Example Dataset
For this guide, we’ll use the following dataset:
| id | name | latitide | longitude |
|---|---|---|---|
| 1 | Berlin | 52.52437 | 13.41053 |
| 2 | Munich | 48.137154 | 11.576124 |
| 3 | Hamburg | 53.551086 | 9.993682 |
You can download the dataset as a CSV file here: points_01.csv
Create Visual and assign data
-
Create the GEOS BI Visual
Drag and drop the GEOS BI visual onto your report canvas.
-
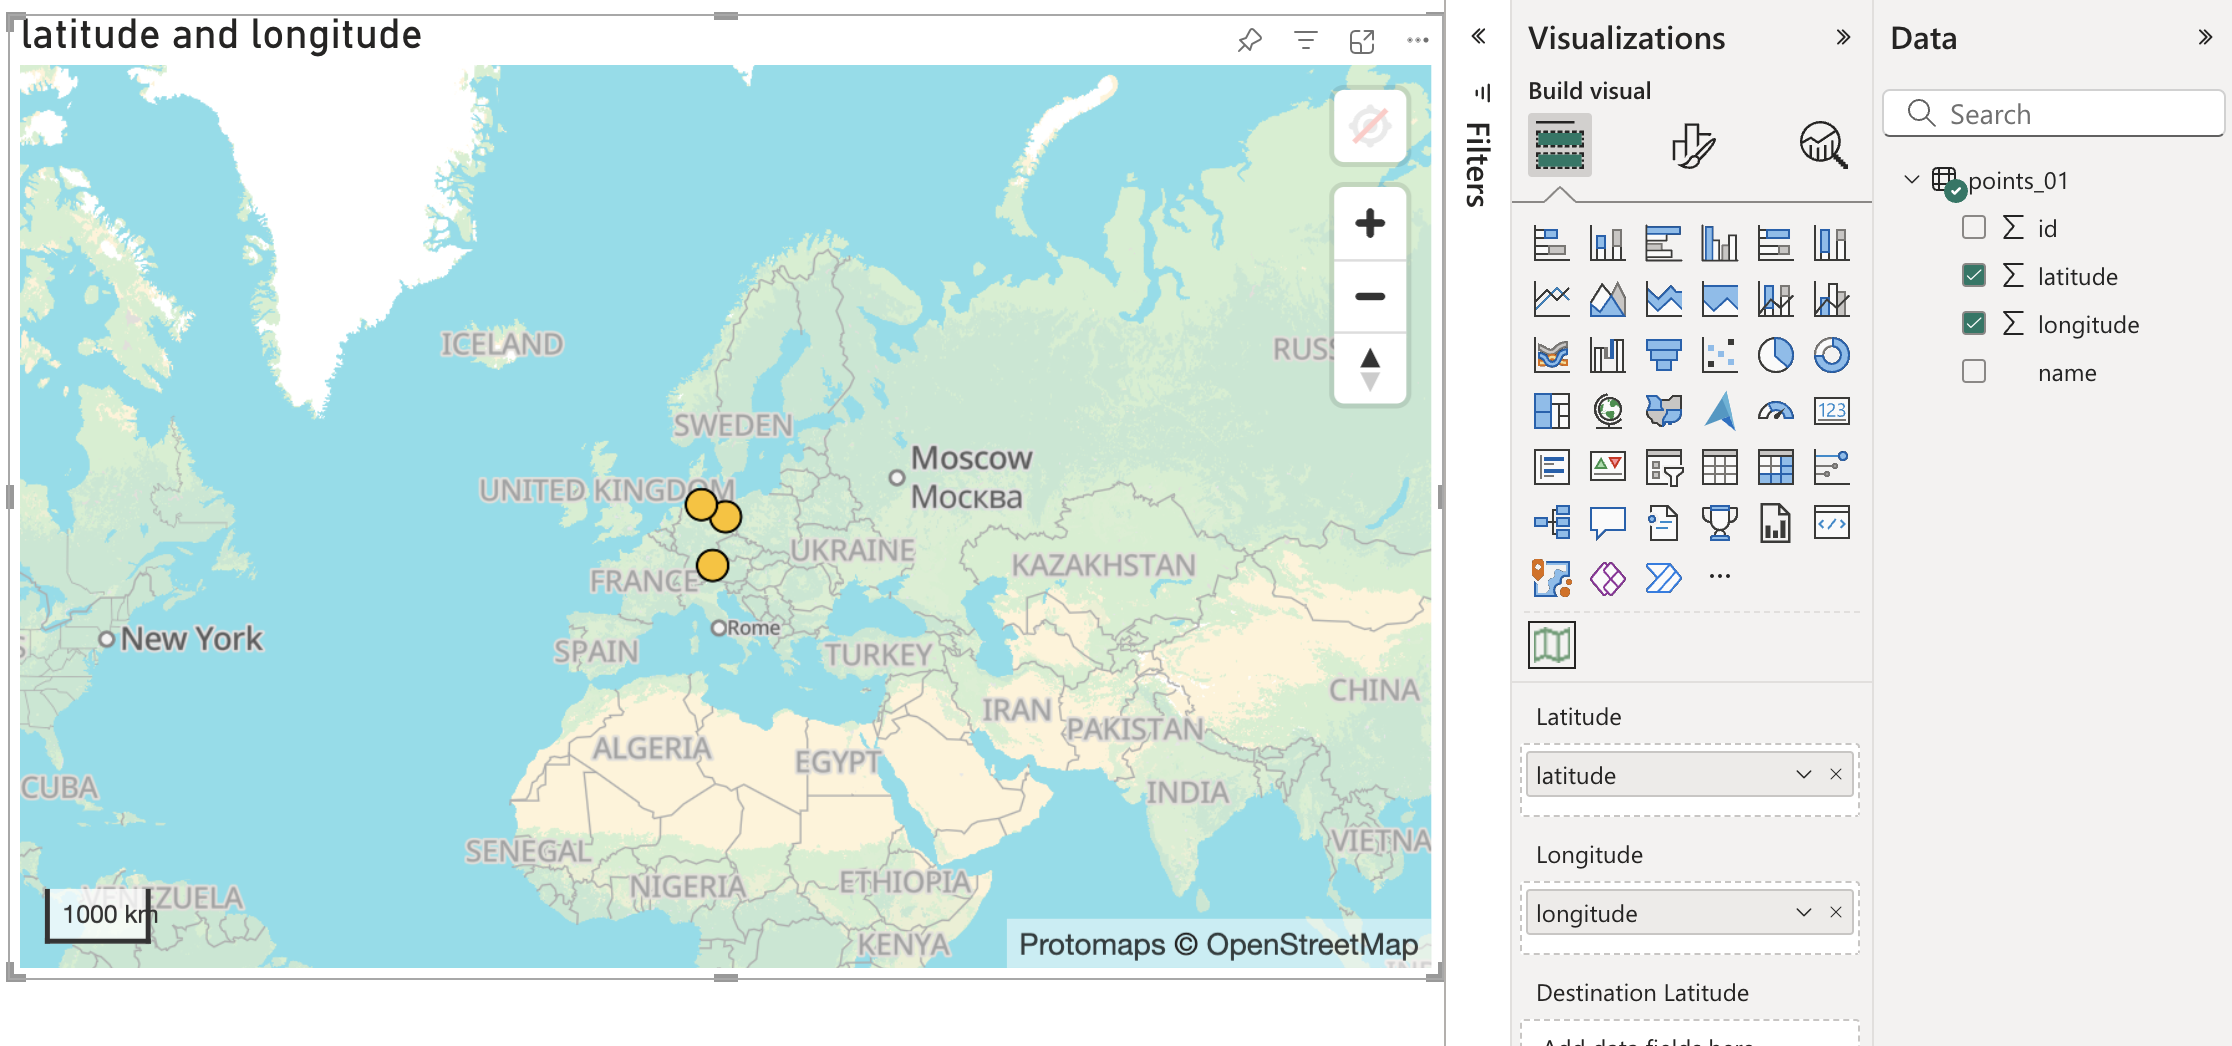
Add Data to the Visual
Assign the latitude and longitude columns from your dataset to the visual. These fields will position the points on the map.
-
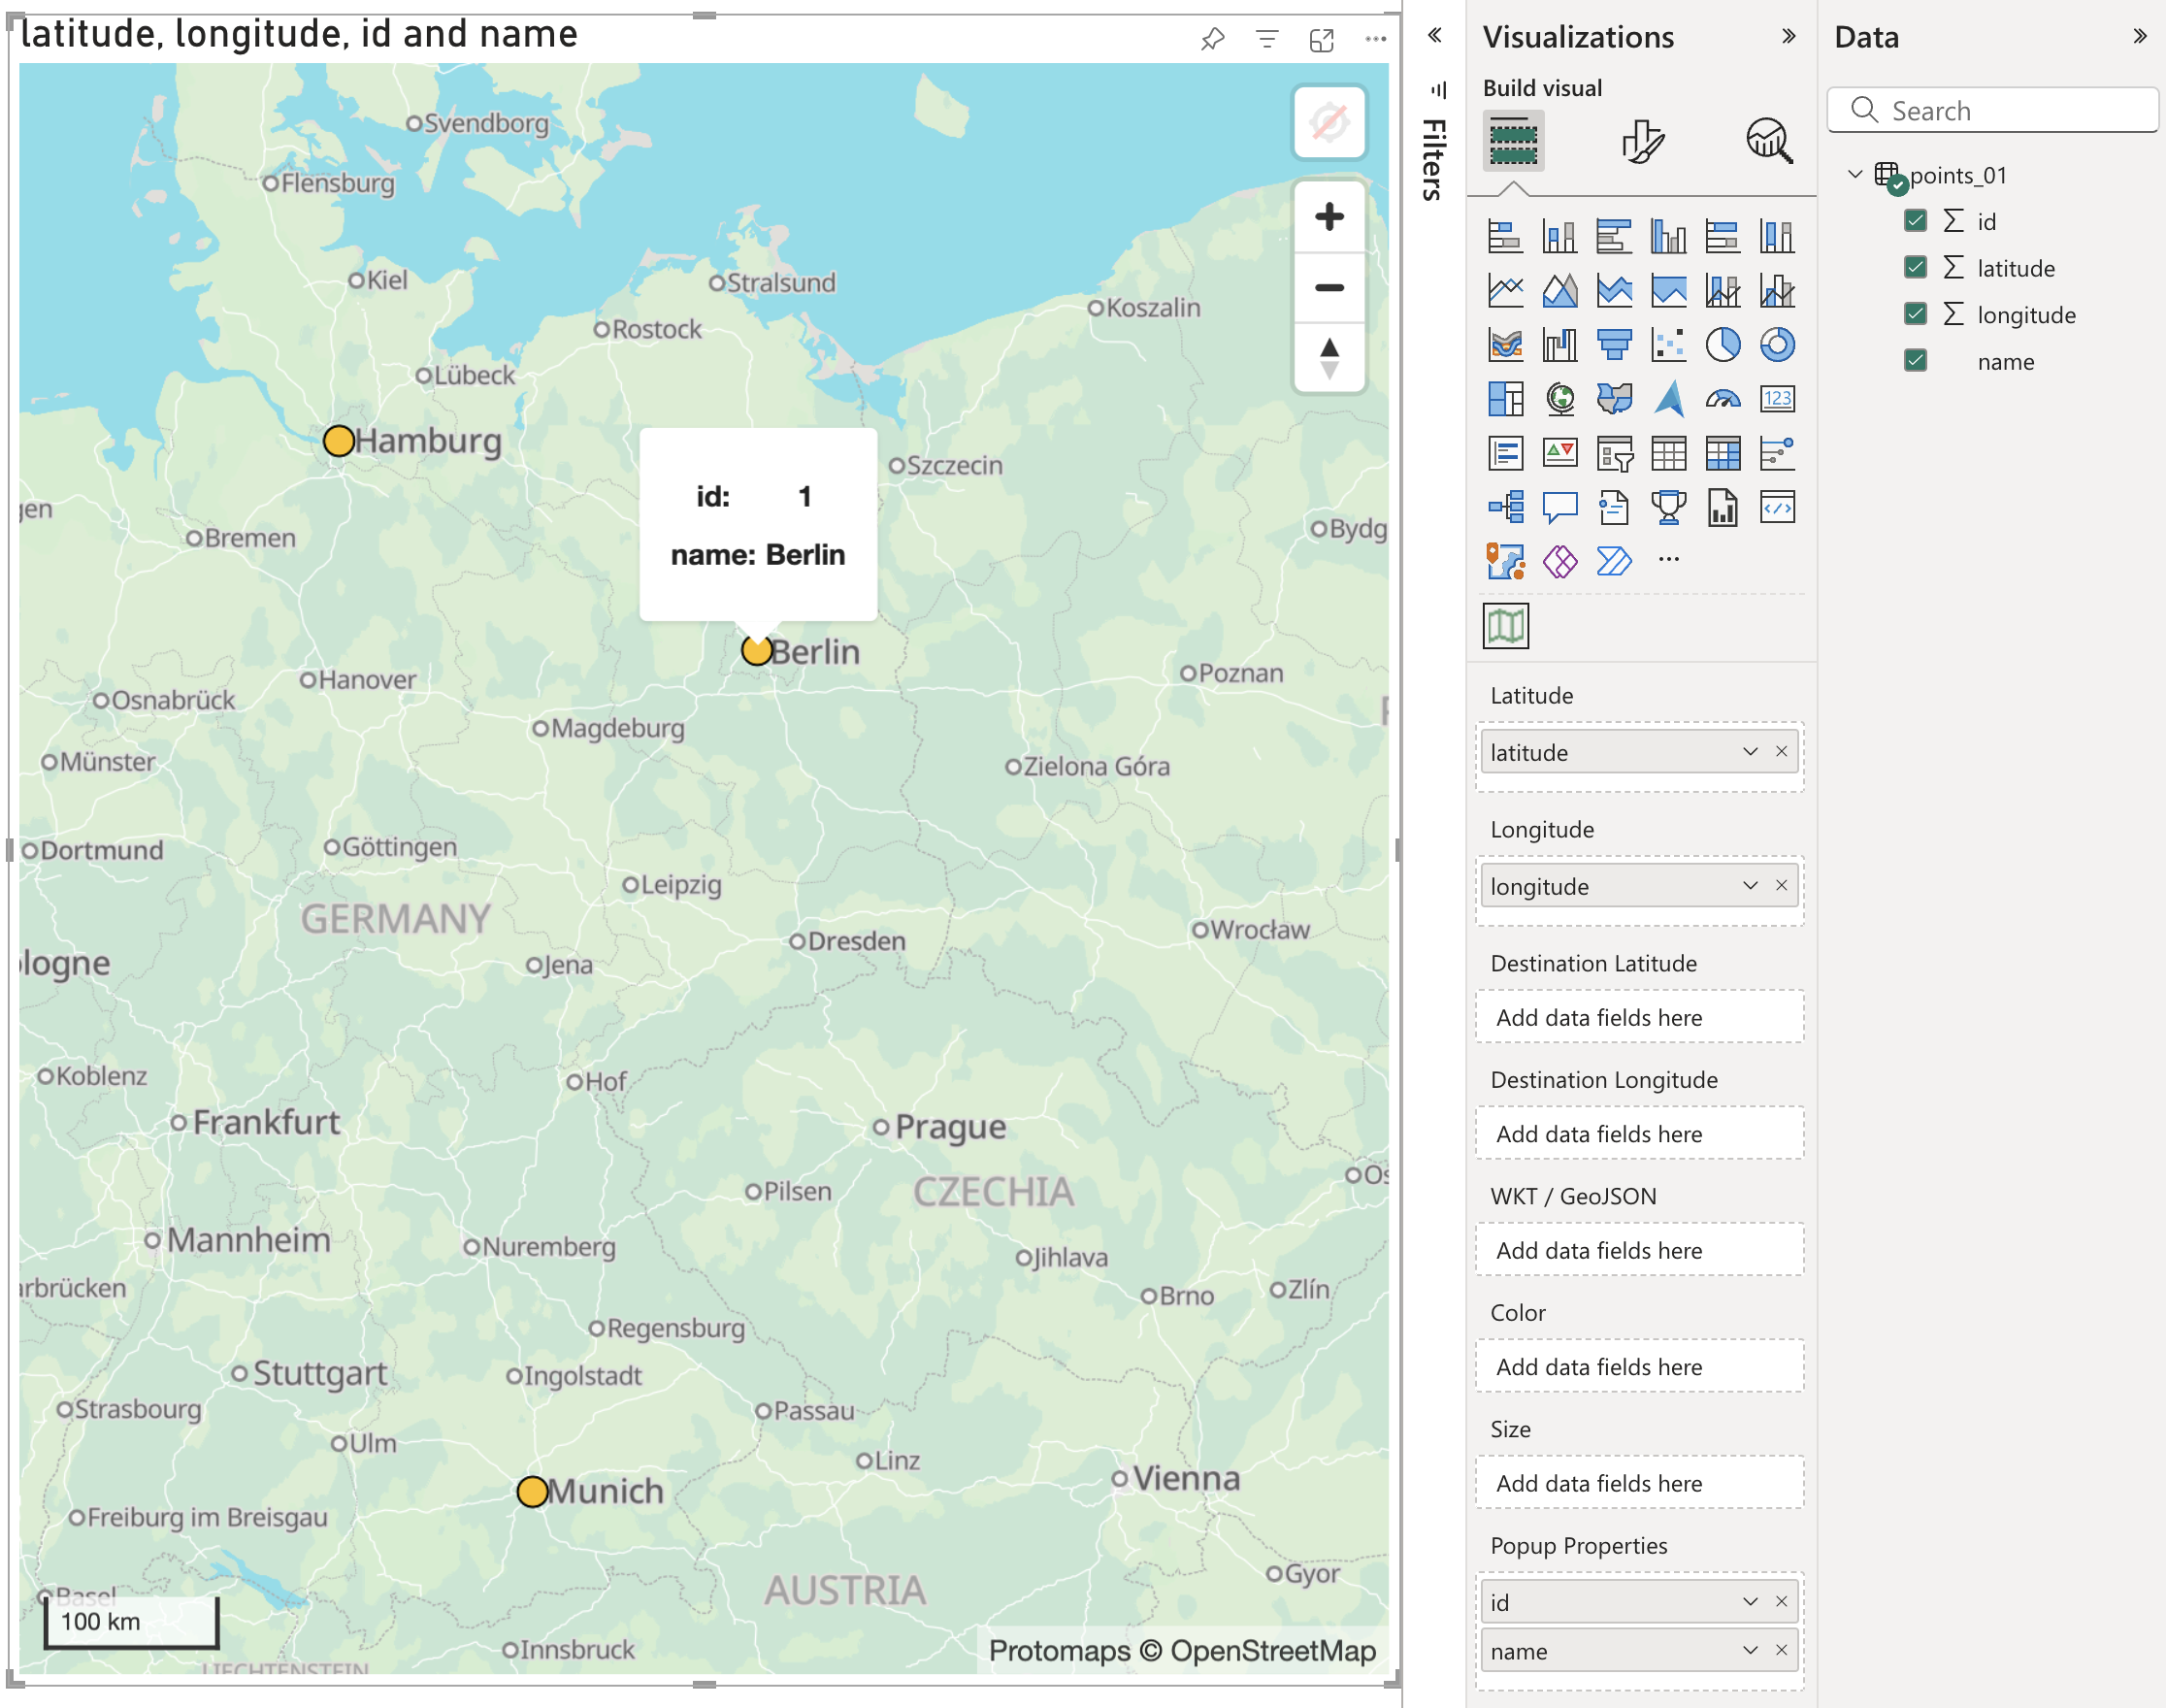
Add Popup Properties for Interactivity
To make the map interactive, add additional fields to the Popup Properties section. This enables users to view details about the points when they hover over them.