Point Clustering
Visualize large point datasets efficiently
Important Note
Currently, Point Clustering is only supported by using the latitude and longitude data fields. Circle data from WKT or GeoJSON sources cannot be displayed as clusters at this time.
Visualizing large point datasets on a map can present several challenges. Not only can it impact the map performance, but it can also lead to visual clutter when thousands of points overlap, making the map difficult to interpret.
Point clustering offers an effective solution to these issues. By grouping nearby points into clusters, you can maintain map performance and improve readability. Enabling point clustering is straightforward. Simply navigate to the formatting settings within the Visualizations pane and toggle on the Add On - Point Clustering option. Once enabled, your points will automatically be grouped into clusters:
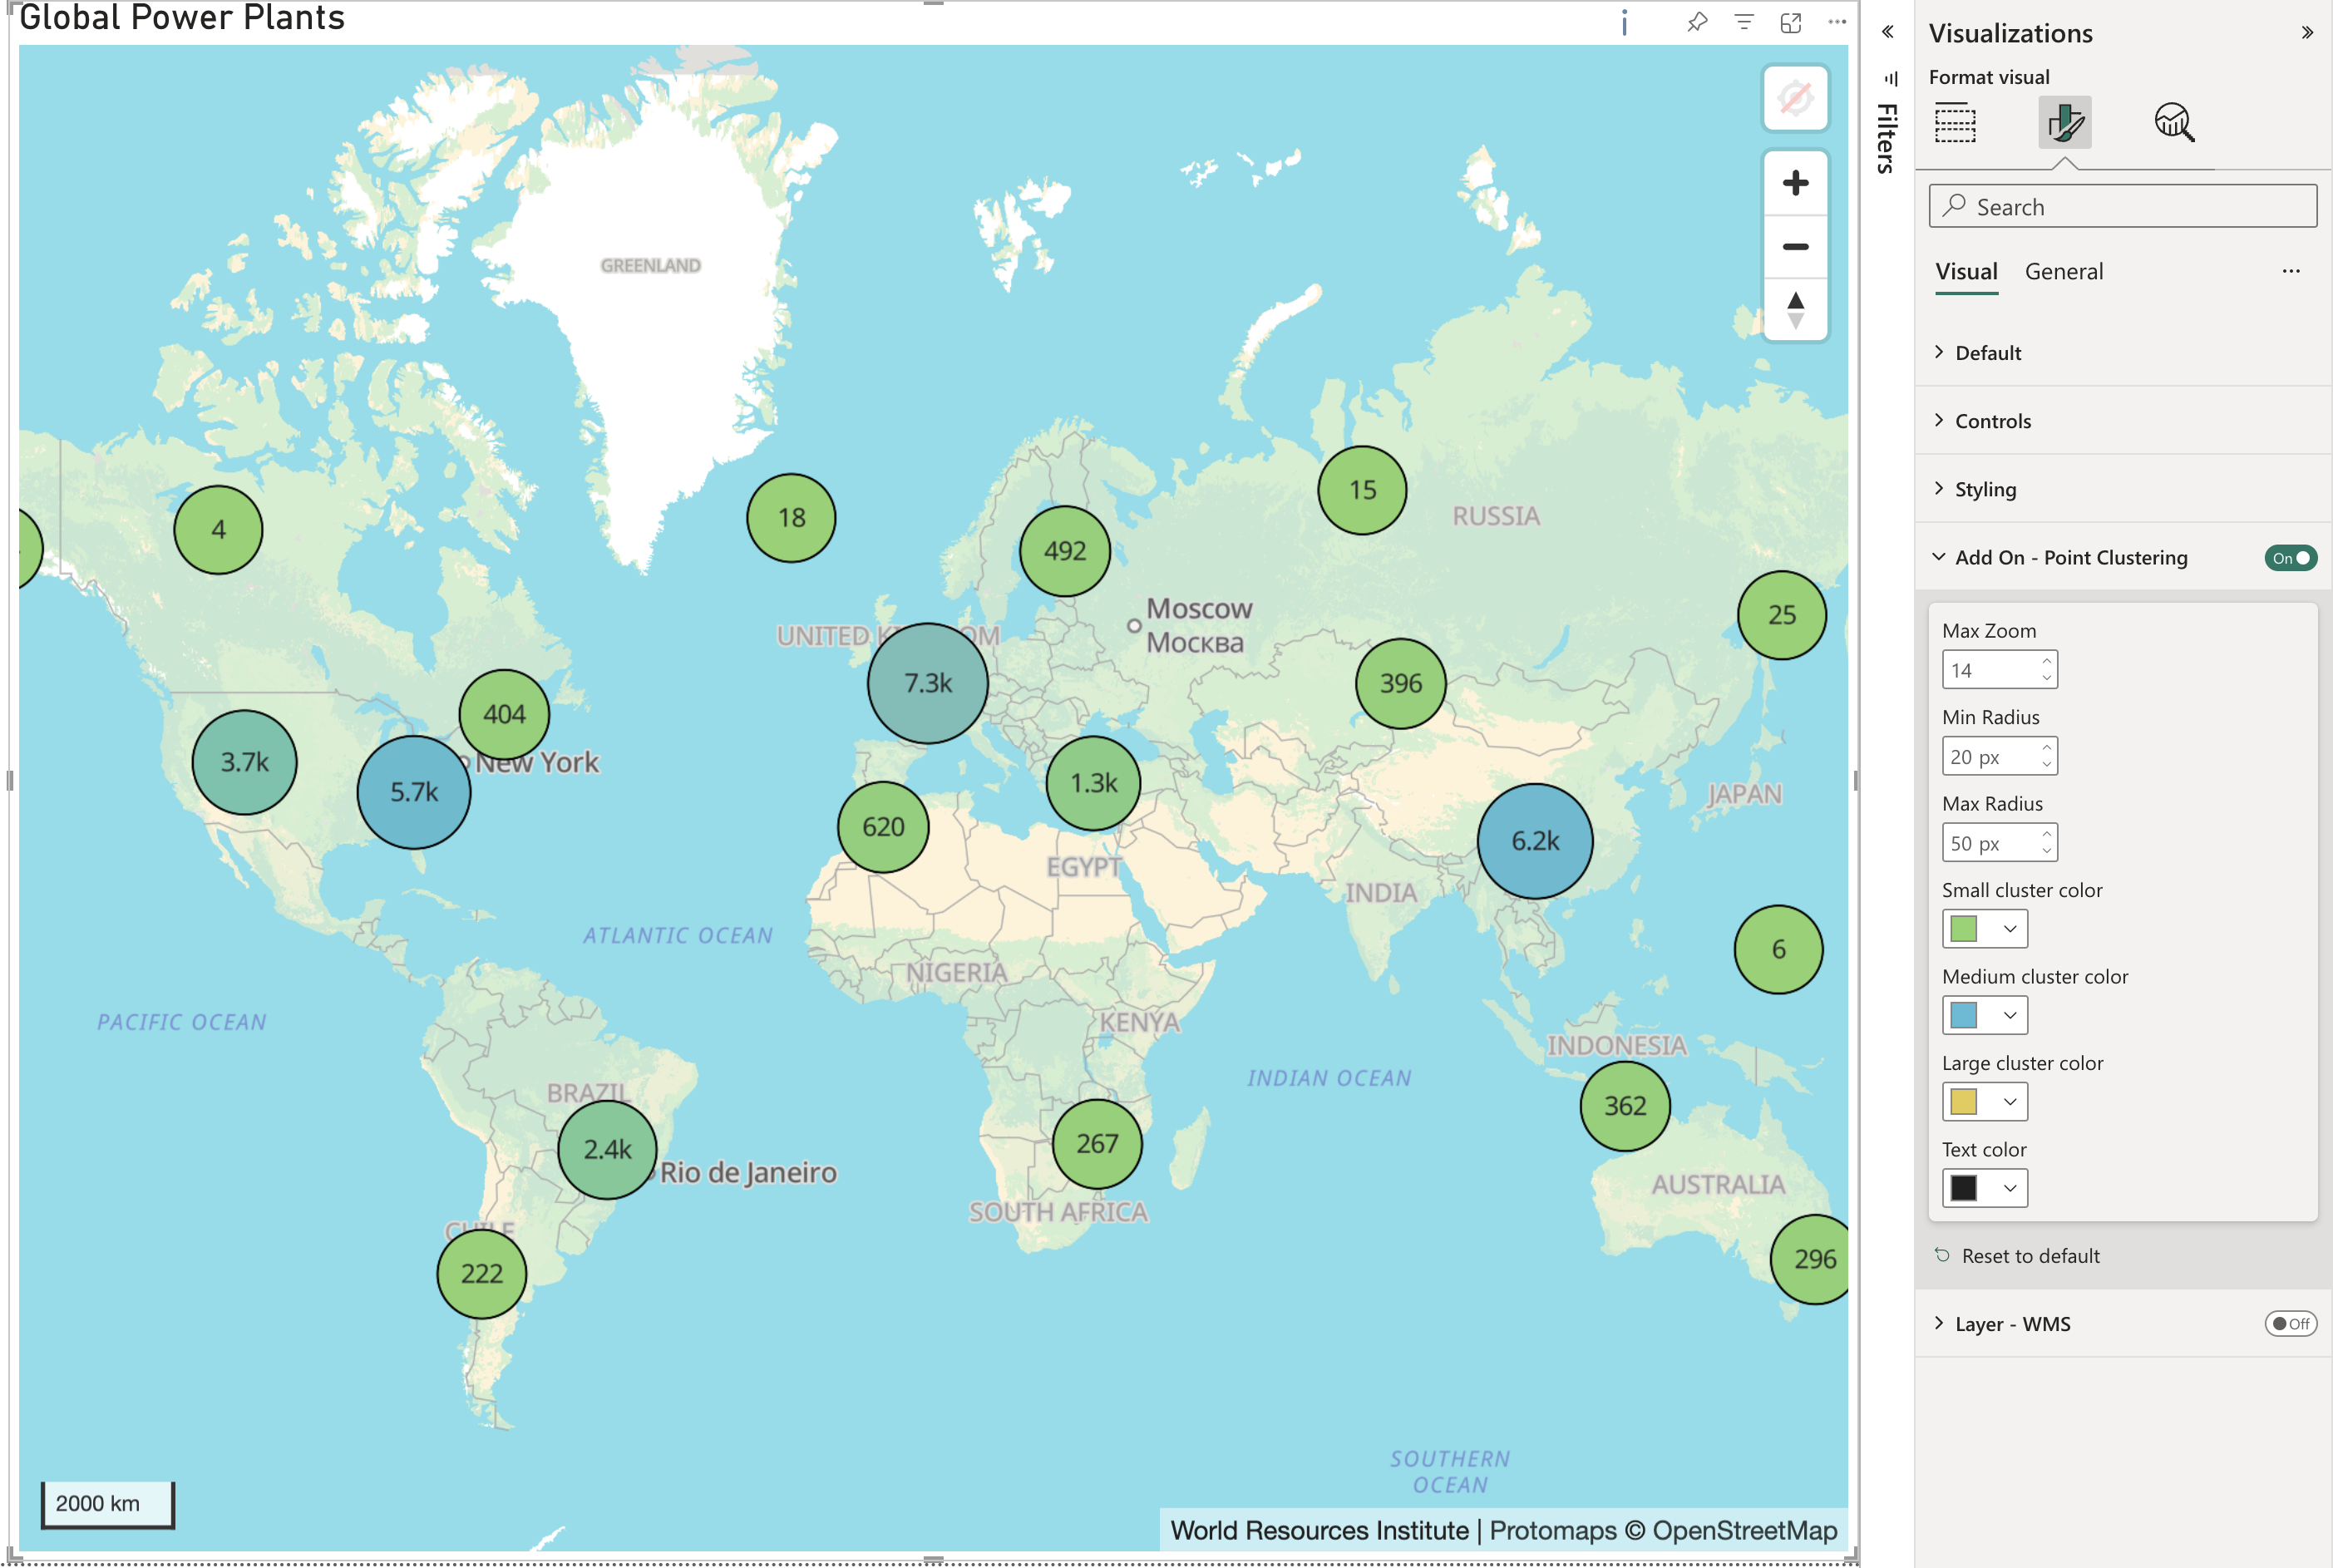
Customizing the appearance of the clusters is also simple. You can adjust the color, size and other stylistic elements of the cluster circles to better suit your needs.